DTiQ Peak Times Speed of Service

Peak Times Speed of Service
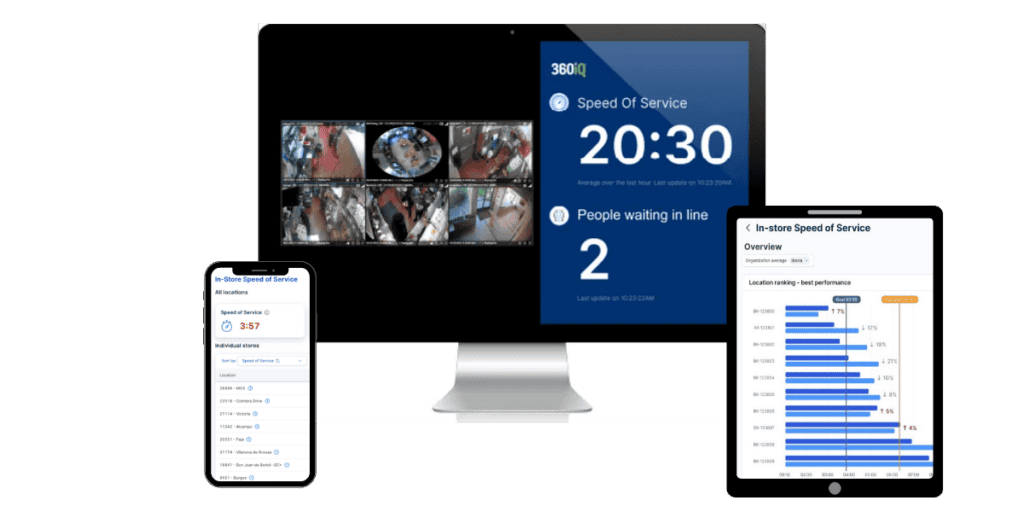
DTiQ Peak Times Speed of Service Dashboard
Monitor up to 3 business hours
Focus on 3 key hours per day like your peak hours when you need to maximize your revenue
Location rankings
Instantly identify best or worst performing stores
Pre-filtered data
Data is pre-filtered and sorted by a traffic light system so you can action upon the data, instantly
Comparative analysis
Compare by day or week and identify opportunities for improvement

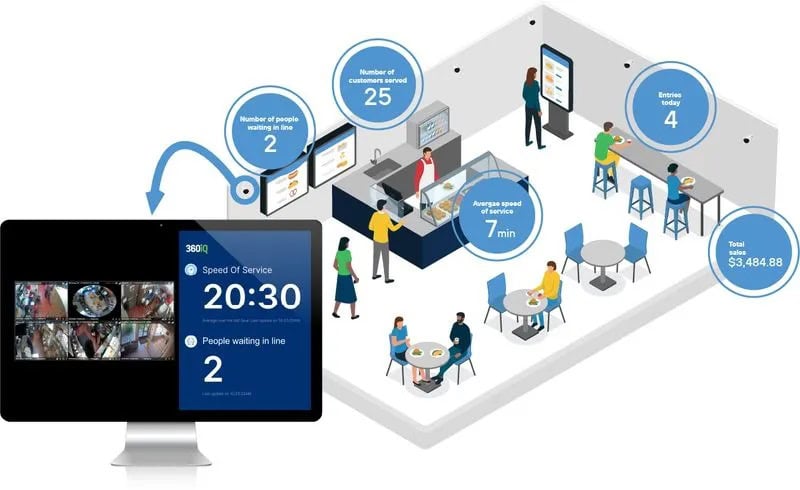
Monitor the customer experience across various real-time dimensions, including entry/exit count, customer count, average wait time, and customers in line.


Actionable Insights
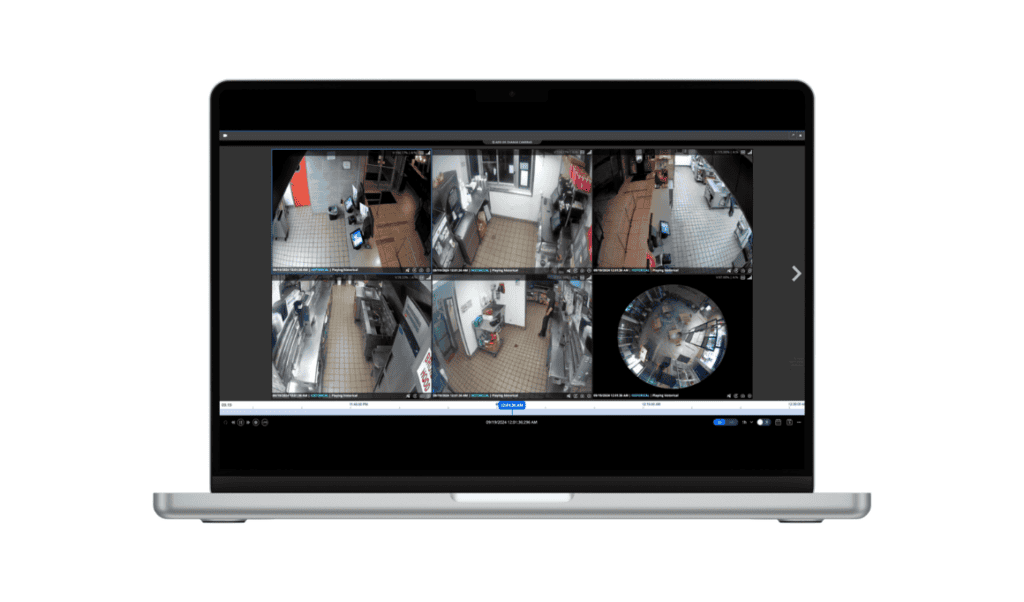
Real-time data and metrics, generated by computer vision, that cannot be altered or manipulated by employees, ensuring accuracy in monitoring in-store customer flow.
- Number of people entering a store
- Amount of time customers wait to place and receive their order
- Average queue length
- Sales per customer entry
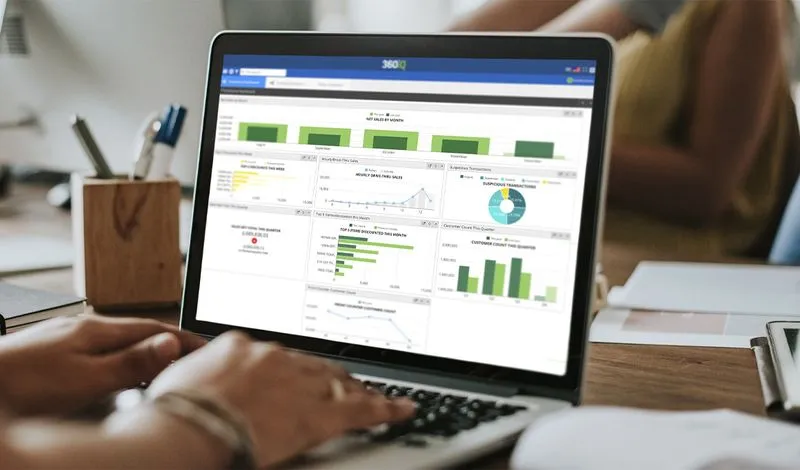
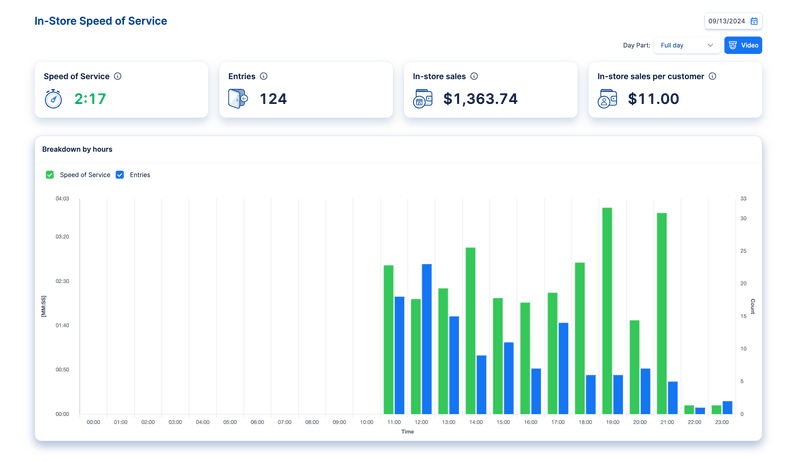
In-Store Speed of Service
A new generation of our In-Store Speed of Service dashboard that helps you improve your store operations, customer experience, and sales results. Already used by over 1,000 stores.
• 24/7/365 speed of service analytics
• Real-time customer flow metrics – Track in-store movements, wait times, and service efficiency with data that can’t be altered by employees.
• Key performance indicators – Number of customers entering, waiting to order, waiting to receive orders, and peak times by daypart.
• Operational excellence – Adjust staffing, review promotions, and optimize operations based on live data to improve customer experience and boost sales.
• Customizable reporting – Access data and video reports on demand in hourly, daily, and weekly time slices, exportable to Excel for in-depth analysis.
• Big Data integration – Dive deeper into trends using your BI tools
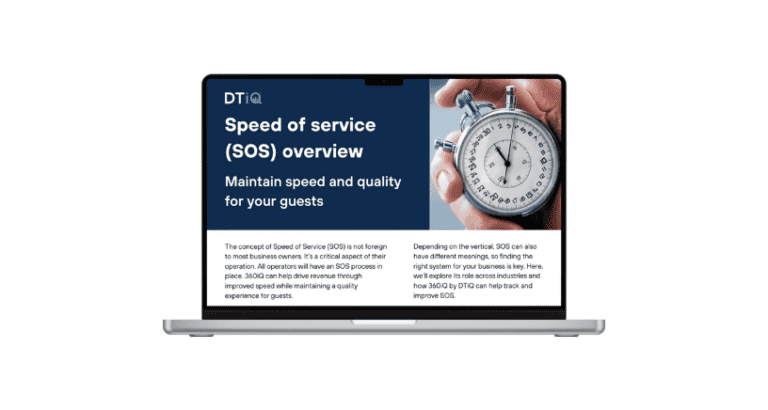
Maintain speed and quality for your guests | Complete SOS guide
Featured Resources


